James Myburgh
07 January 2014
James Myburgh says the two top-ranked provinces owe their position to a massive drop-out rate post-Grade 10
One of the surprises of the 2013 government matric results has been the fact that the Free State (87.4%) and North West (87.2%) secured higher pass rates than both Gauteng (86.9%) and the Western Cape (85.1%), which was pushed into fourth place in the rankings (see table 1 below).
In their reactions to the results both Minister of Basic Education, Angie Motshekga, and the African National Congress, cited the top rankings of these two provinces to rebut claims that the ANC government had failed to deliver decent education to the poor. The ANCstated that: "We are particularly proud of and congratulate the Free State and North West Provinces which were ranked 1st and 2nd best performing provinces respectively. These provinces, which are largely rural and under-resourced, occupy pride of place in our national schooling system."
Critics of the DA in the Western Cape gleefully seized upon the province's slide in the rankings to argue that the Zille administration was failing to deliver. NEHAWU slammed the province's "mediocre performance" while ANC Western Cape leader Marius Fransmanexpressed disappointment at the results and called for a shake-up of the provincial education department.
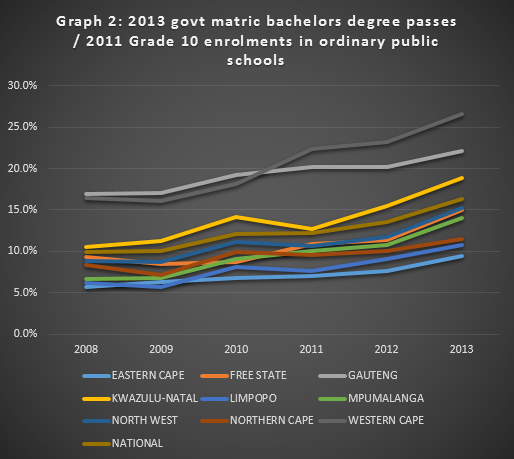
When it comes to Bachelors degree passes - the pass needed to progress on to university study - the Western Cape (40.9%) and Gauteng (38.9%) were ranked first and second, ahead of the North West (34.9%) and Free State (33.1%). Nonetheless, the performance of these two "rural and poor" provinces, as Motshekga describes them, is nonetheless striking. The substantial increase in the government matric pass rate in 2013 still needs to be subjected to proper forensic analysis. However, what the provincial rankings illustrate are the danger of using the pass rate as the sole measure of performance in matric.
Table 1: Government 2013 matric examination results by province
Wrote Passed % pass Ranking Bachelors degree pass BP % Ranking
EASTERN CAPE
72 138 46 840 64.9% 9 13 686 19.0% 9
FREE STATE
27 105 23 689 87.4% 1 8 961 33.1% 3
GAUTENG
97 897 85 112 86.9% 3 38 104 38.9% 2
KWAZULU-NATAL
145 278 112 403 77.4% 6 47 202 32.5% 5
LIMPOPO
82 483 59 184 71.8% 8 18 781 22.8% 8
MPUMALANGA
50 053 38 836 77.6% 5 12 954 25.9% 6
NORTH WEST
29 140 25 414 87.2% 2 10 166 34.9% 4
NORTHERN CAPE
10 403 7 749 74.5% 7 2 424 23.3% 7
WESTERN CAPE
47 615 40 542 85.1% 4 19 477 40.9% 1
NATIONAL
562 112 439 769 78.2% N/A 171 755 30.6% N/A
One of the ways schools and provincial administrations have been traditionally able to increase their pass rates is by "culling" weaker pupils between Grades 10 and Grade 12. In other words huge numbers of ill-educated pupils fall or are pushed out of the system before they even sit down to write final National Senior Certificate examinations.
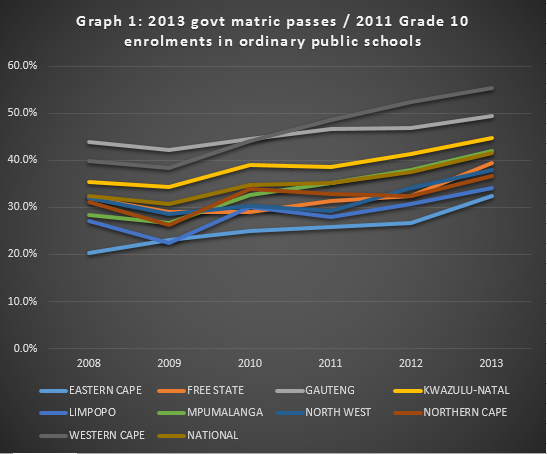
One means of controlling for this is to measure the number of government matric passes against the number of pupils in Grade 10 two years previously. This is not a perfect measure as higher numbers of pupils tend to be held back in Grade 10 than in earlier years (see the paper by Dr Stephen Taylor here - PDF.) Another wrinkle is that while the Department of Basic Education provides a breakdown, in its published literature, of the number of pupils in independent and government schools in Grade 10 it is does not provide a similar breakdown for the government matric exam results, even though a significant number of pupils in independent schools sit this exam rather than the IEB one. The effect is however relatively marginal given the small percentage of pupils (4%) in independent schools.
If one measures, by province, the ratio of the 2013 government matric results against the 2011 Grade 10 government school enrolment figures it is evident that the Free State and the North West owe much of their current success to an exceedingly high drop-out rate in the two years preceding matric. Indeed, of all provinces, the North West had the highest drop-out rate between Grade 10 and matric (56.5%) with the Free State following closely behind (54.8%). By contrast, the Western Cape had by far the lowest drop-out rate (35%), followed by KwaZulu-Natal (42.1%) and Gauteng (43.2%). See Table 2.
Table 2: Number of government matric passes in 2013 against the number of pupils in Grade 10 in 2011*
|
|
Pupils in grade 10 in
2011
|
Numbers who wrote govt
matric in 2013
|
% of 2011
|
Passed
|
% of 2011
|
Rank
|
Bachelors pass
|
% of 2011
|
Rank
|
|
|
144 855
|
72 138
|
49.8
|
46 840
|
32.3
|
9
|
13 686
|
9.4
|
9
|
|
|
60 012
|
27 105
|
45.2
|
23 689
|
39.5
|
5
|
8 961
|
14.9
|
5
|
|
GAUTENG
|
172 430
|
97 897
|
56.8
|
85 112
|
49.4
|
2
|
38 104
|
22.1
|
2
|
|
|
250 755
|
145 278
|
57.9
|
112 403
|
44.8
|
3
|
47 202
|
18.8
|
3
|
|
|
173 722
|
82 483
|
47.5
|
59 184
|
34.1
|
8
|
18 781
|
10.8
|
8
|
|
MPUMALANGA
|
92 677
|
50 053
|
54.0
|
38 836
|
41.9
|
4
|
12 954
|
14.0
|
6
|
|
NORTH WEST
|
66 916
|
29 140
|
43.5
|
25 414
|
38.0
|
6
|
10 166
|
15.2
|
4
|
|
|
21 162
|
10 403
|
49.2
|
7 749
|
36.6
|
7
|
2 424
|
11.5
|
7
|
|
|
73 261
|
47 615
|
65.0
|
40 542
|
55.3
|
1
|
19 477
|
26.6
|
1
|
|
NATIONAL
|
1 055 790
|
562 112
|
53.2
|
439 769
|
41.7
|
|
171 755
|
16.3
|
|
Dividing the number of pupils who passed the 2013 government matric over the number of Grade 10 pupils in ordinary public schools in 2011 - rather than simply the number who sat the examinations - may be a somewhat crude measure, given the provisos mentioned above, but it provides a far more realistic picture of provincial performance. On this measure the Western Cape has by far the highest percentage passing matric (55.3%), followed by Gauteng (49.4%) and then KwaZulu-Natal (44.8%). The Free State and North West come limping in, in 5th and 6th place respectively.
What this does not explain however is the jump in the government matric pass rate to 78.2% in 2013 from 73,9% in 2012, and 70,2% the year before that. The degree to which this increase reflects political manipulation, rather than an underlying improvement in educational standards, awaits further analysis.
***
Data sources: DBE, Education Statistics in South Africa reports from 2006 - 2011, NSC examination reports 2008-2013
This article was published with the assistance of the Friedrich-Naumann-Stiftung für die Freiheit (FNF). The views presented in the article are those of the author and do not necessarily represent the views of FNF.
This comment has been removed by the author.
ReplyDeleteBad paper: doesn't control for population differences (pure numbers: 2.8 mil in the Free State vs. 6 mil in the WC - yet only 13 261 more learners in grade 10 in the WC in 2011); by its own admission uses a bad measure for comparison (grade 10 is an unreliable indicator of numbers in high school: how would we know, for example, if dropout rates are higher between grade 8 and grade 10 in any of the provinces? Also, the first school-leaving opportunity in South Africa is the end of grade 9, not grade 10); extra variables that need to be taken into account are simply ignored (Like 20.2% and 49.7% of the WC speaking English, Afrikaans respectively vs. about 5.6% speaking English and 12.2% speaking Afrikaans in the FS or the fact that two thirds of the WC's population resides in Cape Town vs. 13% of the FS's population living in Bloemfontein. This paper basically makes the argument that the pass rate is not a good enough measure for "success" or "failure" with an added backhand to the provinces in question. The question, as an analogy, springs to mind: is Usain Bolt the "world's fastest man" because he holds the world 100m sprint record? "Proper forensic analysis" my left foot: one can't make value judgements like "The FS and NW provinces' success is illusionary" based on this.
ReplyDelete