Saturday, January 18, 2014

Dropouts and passes: How far has education really come?

17 JAN 2014 00:00

The launch of Blade Nzimande's white paper and the audited data on universities exposes the steady pattern of dropouts, failure and graduation.

ANALYSIS

Between government's release this week of its landmark white paper on post-school education and training, and its orgiastic celebration last week of the 2013 matric results, another document rather more modestly entered the public domain.

Released on Wednesday by the statutorily independent Council on Higher Education, it presented the latest audited data on universities. This showed that about half of all students who enter university drop out before they complete their degrees or diplomas.

This trend is not itself news. But the document's publication the day before Higher Education and Training Minister Blade Nzimande launched his white paper in Pretoria usefully reminded us of one lens through which to examine the paper.

This lens is that the patterns of university dropout, failure and graduation have remained essentially the same since data reliable enough to measure them first became available about 14 years ago.

This puts the white paper's subtitle – Building an Expanded, Effective and Integrated System – into especially sharp focus.

Losing 50% of university entrants along the path of their studies points to a system that is neither effective nor expanded (regarding both students' access to it and their success within it), and to one that is also very poorly integrated with the schooling that supplies universities with their students.

Unemployment
Fortunately, this week's white paper acknowledges these realities as unflinchingly as its January 2012 green paper predecessor did.

So, too, with perhaps the most socially dangerous post-school fact of all: that the numbers of 15- to 24-year-olds who are not in employment, education or training (the so-called "neets") soar annually.

Estimated at two million in 1996, Nzimande said on Thursday the current figure is 3.4-million.

This is why "we are not only interested in those who got seven As at school ... A strategy is required to pull [the "neets"] out of the doldrums of poverty and misery."

Fortunately also, therefore, the white paper centralises the 2012 green paper's most innovative proposal for rescuing these marginalised millions: the post-schooling terrain will now acquire "a new type of institution", Nzimande said.

These will be "community colleges" that will enrol youth and adults who either never attended school or dropped out of schooling without a formal qualification. They will be multi-campus institutions that group together different public adult learning centres.

Responding to the chronic lack of resources that has crippled these centres, the new community colleges will be fully equipped with full-time staff (itself an innovation) and "adequate infrastructure", Nzimande said.

Elephant in the room
So far, so good. But the elephant in the white paper's spacious room is basic education: we would not have anything like 3.4-million "neets" if schooling was any better, and nowhere near a 50% dropout rate from universities.

For very much straighter talking, one has to turn (again) to the Council on Higher Education. Its hard-hitting but evidence-based report in August last year concluded there is "no prospect" the schooling sector will be able to produce "in the foreseeable future" the numbers of adequately prepared matriculants that universities (and the country) require.

This alone puts the white paper's ambitious target of expanding university enrolment from 900 000 students now to 1.6-million by 2030 in question.

There is no point in increasing access without also seriously improving success. But how the white paper intends to do that remains as radically unclear as the green paper was.

Zuma's mud schools remark an insult - DA

2014-01-18 05:30

President Jacob Zuma (Picture: GCIS)

Johannesburg - A remark by President Jacob Zuma on mud schools was an insult to children, the DA in the Eastern Cape said on Friday.

DA spokesperson Edmund van Vuuren accused Zuma of saying: "We want to eradicate all mud schools. We are not in a hurry because no one is going to rule but the ANC."

Zuma was speaking on Thursday at the opening of the Ngidini Senior Primary School, Eastern Cape, a former mud school, he said.

"This insensitive utterance is an insult to the hundreds of children who have to endure schooling in under-resourced and unsafe building infrastructures throughout the Eastern Cape," Van Vuuren said.

The party called for the president to apologise.

Presidency spokesperson Mac Maharaj said the report was incorrect.

"I do not want to respond to any political party that relies on inaccurate reports for their statements," Maharaj said.

- SAPA

Friday, January 10, 2014

AND THIS IS WHAT WE CALL AN EDUCATION DEPARTMENT


I am at a total loss for words. What was the 2013 Matric pass rate again?

Matric results: Zuma plays the race card again

Jan 10, 2014 | 8:35 AM |by Contributor
President Jacob Zuma has accused DA leader Helen Zille of having “that old mentality that black people are not intelligent”.

(Photo by Gallo Images / Foto24 / Alet Pretorius)

Old “white mentality”

At the ANC’s 102nd birthday celebrations in Mpumalanga, Zuma was heard talking to the crowds saying, “I heard this white person saying let there be an investigation, they can’t pass like this, and I said to myself, this person still has that old mentality that black people are not intelligent, if they succeed it must be probed.”

According to eNCA, who interpreted the original quote from Zulu, it was a thinly veiled reference to Zille’s request to have the matric exam results audited. 
White South Africans fear success of black matriculants

According to reports, education analyst Graeme Bloch has called on white South Africans to be more supportive of the improvements in matric exam results.

This comes after Zille questioned the large increase in successful matric passes in the Mpumalanga and North West regions of South Africa.

Some white people actively “don’t like the increase in results”, said Bloch. “They don’t like to see the progress, because they don’t like the government succeeding.”

Thursday, January 9, 2014

Matric 2013: Why the FState and NWest's success is illusionary

James Myburgh

07 January 2014

James Myburgh says the two top-ranked provinces owe their position to a massive drop-out rate post-Grade 10

One of the surprises of the 2013 government matric results has been the fact that the Free State (87.4%) and North West (87.2%) secured higher pass rates than both Gauteng (86.9%) and the Western Cape (85.1%), which was pushed into fourth place in the rankings (see table 1 below).

In their reactions to the results both Minister of Basic Education, Angie Motshekga, and the African National Congress, cited the top rankings of these two provinces to rebut claims that the ANC government had failed to deliver decent education to the poor. The ANCstated that: "We are particularly proud of and congratulate the Free State and North West Provinces which were ranked 1st and 2nd best performing provinces respectively. These provinces, which are largely rural and under-resourced, occupy pride of place in our national schooling system."

Critics of the DA in the Western Cape gleefully seized upon the province's slide in the rankings to argue that the Zille administration was failing to deliver. NEHAWU slammed the province's "mediocre performance" while ANC Western Cape leader Marius Fransmanexpressed disappointment at the results and called for a shake-up of the provincial education department.

When it comes to Bachelors degree passes - the pass needed to progress on to university study - the Western Cape (40.9%) and Gauteng (38.9%) were ranked first and second, ahead of the North West (34.9%) and Free State (33.1%). Nonetheless, the performance of these two "rural and poor" provinces, as Motshekga describes them, is nonetheless striking. The substantial increase in the government matric pass rate in 2013 still needs to be subjected to proper forensic analysis. However, what the provincial rankings illustrate are the danger of using the pass rate as the sole measure of performance in matric.

Table 1: Government 2013 matric examination results by province

Wrote       Passed      % pass     Ranking      Bachelors degree pass      BP %           Ranking 

EASTERN CAPE 

72 138     46 840      64.9%      9                 13 686                             19.0%          9

FREE STATE 

27 105     23 689      87.4%      1                   8 961                             33.1%          3

GAUTENG 

97 897     85 112      86.9%      3                  38 104                            38.9%          2

KWAZULU-NATAL 

145 278   112 403    77.4%      6                  47 202                            32.5%          5

LIMPOPO 

82 483     59 184      71.8%      8                  18 781                            22.8%          8

MPUMALANGA 

50 053     38 836      77.6%      5                  12 954                            25.9%          6

NORTH WEST 

29 140     25 414       87.2%     2                  10 166                           34.9%          4

NORTHERN CAPE 

10 403       7 749       74.5%     7                     2 424                           23.3%         7

WESTERN CAPE 

47 615      40 542      85.1%     4                   19 477                           40.9%         1

NATIONAL 

562 112    439 769    78.2%     N/A             171 755                          30.6%         N/A

One of the ways schools and provincial administrations have been traditionally able to increase their pass rates is by "culling" weaker pupils between Grades 10 and Grade 12. In other words huge numbers of ill-educated pupils fall or are pushed out of the system before they even sit down to write final National Senior Certificate examinations.

One means of controlling for this is to measure the number of government matric passes against the number of pupils in Grade 10 two years previously. This is not a perfect measure as higher numbers of pupils tend to be held back in Grade 10 than in earlier years (see the paper by Dr Stephen Taylor here - PDF.) Another wrinkle is that while the Department of Basic Education provides a breakdown, in its published literature, of the number of pupils in independent and government schools in Grade 10 it is does not provide a similar breakdown for the government matric exam results, even though a significant number of pupils in independent schools sit this exam rather than the IEB one. The effect is however relatively marginal given the small percentage of pupils (4%) in independent schools.

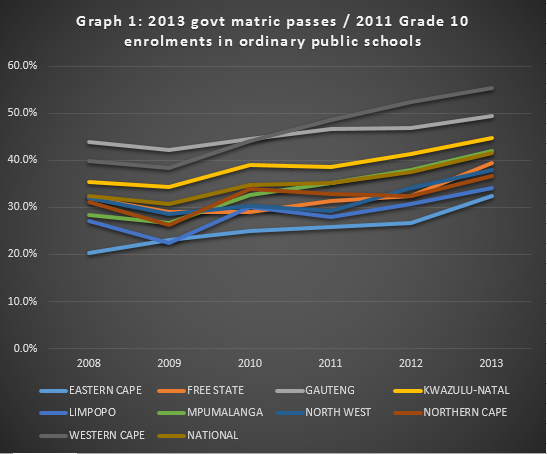
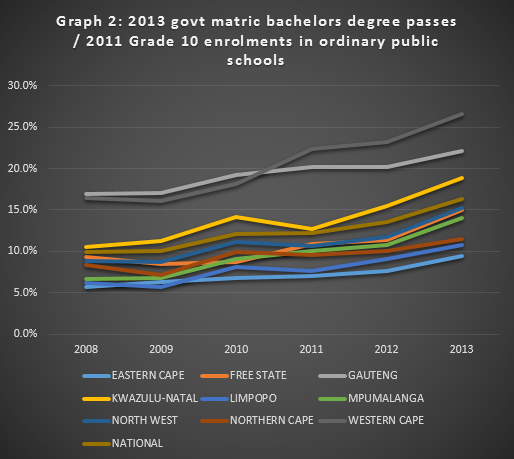
If one measures, by province, the ratio of the 2013 government matric results against the 2011 Grade 10 government school enrolment figures it is evident that the Free State and the North West owe much of their current success to an exceedingly high drop-out rate in the two years preceding matric. Indeed, of all provinces, the North West had the highest drop-out rate between Grade 10 and matric (56.5%) with the Free State following closely behind (54.8%). By contrast, the Western Cape had by far the lowest drop-out rate (35%), followed by KwaZulu-Natal (42.1%) and Gauteng (43.2%). See Table 2.

Table 2: Number of government matric passes in 2013 against the number of pupils in Grade 10 in 2011*


Pupils in grade 10 in 2011
Numbers who wrote govt matric in 2013
% of 2011
Passed
% of 2011
Rank
Bachelors pass
% of 2011
Rank
EASTERN CAPE
144 855
72 138
49.8
46 840
32.3
9
13 686
9.4
9
FREE STATE
60 012
27 105
45.2
23 689
39.5
5
8 961
14.9
5
GAUTENG
172 430
97 897
56.8
85 112
49.4
2
38 104
22.1
2
KWAZULU-NATAL
250 755
145 278
57.9
112 403
44.8
3
47 202
18.8
3
LIMPOPO
173 722
82 483
47.5
59 184
34.1
8
18 781
10.8
8
MPUMALANGA
92 677
50 053
54.0
38 836
41.9
4
12 954
14.0
6
NORTH WEST
66 916
29 140
43.5
25 414
38.0
6
10 166
15.2
4
NORTHERN CAPE
21 162
10 403
49.2
7 749
36.6
7
2 424
11.5
7
WESTERN CAPE
73 261
47 615
65.0
40 542
55.3
1
19 477
26.6
1
NATIONAL
1 055 790
562 112
53.2
439 769
41.7

171 755
16.3

Dividing the number of pupils who passed the 2013 government matric over the number of Grade 10 pupils in ordinary public schools in 2011 - rather than simply the number who sat the examinations - may be a somewhat crude measure, given the provisos mentioned above, but it provides a far more realistic picture of provincial performance. On this measure the Western Cape has by far the highest percentage passing matric (55.3%), followed by Gauteng (49.4%) and then KwaZulu-Natal (44.8%). The Free State and North West come limping in, in 5th and 6th place respectively.

What this does not explain however is the jump in the government matric pass rate to 78.2% in 2013 from 73,9% in 2012, and 70,2% the year before that. The degree to which this increase reflects political manipulation, rather than an underlying improvement in educational standards, awaits further analysis.


***


Data sources: DBE, Education Statistics in South Africa reports from 2006 - 2011, NSC examination reports 2008-2013

This article was published with the assistance of the Friedrich-Naumann-Stiftung für die Freiheit (FNF). The views presented in the article are those of the author and do not necessarily represent the views of FNF.

Sunday, January 5, 2014

We need a 50% matric pass rate, says Jansen

Sapa | 05 January, 2014 10:19


University of the Freestate vice-chancellor and Director Jonathan Jansen.
Image by: Sunday Times/Kevin Sutherland / Gallo Images

Government schools should set a 50% pass rate to get South African's education system on track, says University of Free State vice-chancellor Jonathan Jansen, according to a report.

"We should begin by raising the pass mark for all school subjects to 50 percent, the (still admittedly low) standard set for academic work in most contexts," Jansen wrote in an opinion piece for the Sunday Times.

"Schools are self-regulating systems with the remarkable capacity to adjust to a new standard over time."

Jansen said no matter what pass rate was announced for the Grade 12 national senior certificate on Monday, the results were "grossly misleading".

"These pass rates are still calculated at a base of 30 percent in some subjects and 40 percent in others."

Jansen raised concern about the "culling process" in which about 500 000 pupils who started Grade One dropped out before matric.

He highlighted a problem with new policy that "forbids" a student from failing a grade in the FET (Grade 10-12) phase more than once.

"Failing once means you will find yourself automatically promoted."

Jansen said instability in teacher unions needed to be calmed.

"The long-term resolution of the school's crisis is only partly educational; it is in the first place political."

IEB matric pass rate increases in 2013

Sapa | 31 December, 2013 08:26

Pupils searching for their Matric results. File photo.

The Independent Examinations Board's (IEB) matric result pass rate for 2013 increased to 98.6% this year from last year's 98.2%.

"[A total of] 9 580 full-time and 586 part-time candidates from 185 schools across the country wrote the... IEB National Senior Certificate examinations in November 2013," IEB CEO Anne Oberholzer said in a statement on Tuesday.

"All candidates that passed achieved a pass that is good enough to enter tertiary study at one of the three levels."

Eighty-five percent of the pupils who wrote the IEB matric exam would be able to study towards a degree. Twelve percent qualified for entry to diploma study and 1.5% could study towards a higher certificate.

In 2013, an additional 621 pupils wrote the IEB exam due to four new schools joining the system and increased pupil numbers at the other institutions. Besides the schools in South Africa, 13 schools in Namibia, Swaziland and Mozambique also wrote the IEB exams.

Oberholzer said 55 pupils completed a combined NSC-Abitur qualification offered by the German schools in Johannesburg, Pretoria and Cape Town. This allowed them access to university study in South Africa or Germany.

Also released on Monday were the results of the IEB advanced programme (AP) courses. Oberholzer said the curricula and assessment of the advanced programme courses offered in English, Afrikaans and mathematics were benchmarked as equivalent to A-level courses in the United Kingdom.

"These courses are available to Grade 12 learners in IEB schools, as well as schools that write the state NSC examination."

Out of the 2103 candidates who wrote AP mathematics, 81 percent passed. Of the 555 candidates who wrote AP English, 96.2% passed.

AP Afrikaans was offered for the first time in 2013 and achieved a 100% pass rate.

Oberholzer said the exams were problem-free and approved by Umalusi, the council for quality assurance in general and further education and training.